Using the thinkorswim® App for AI-Like Efficiency

The thinkorswim® trading platform offers hundreds of functions that traders can leverage to replicate the efficiency of artificial intelligence (AI) without multiple apps or the potential for hallucinations.
Log in to the thinkorswim desktop platform and follow the guidance below to help generate trade ideas, monitor the news, streamline technical analysis, and evaluate performance.
1. Generate trade ideas
Source: thinkorswim® desktop platform for Mac.
Screenshots are for illustrative purposes only, may be historical in nature, and should not be used as the basis for any investment decision.
Stock Hacker
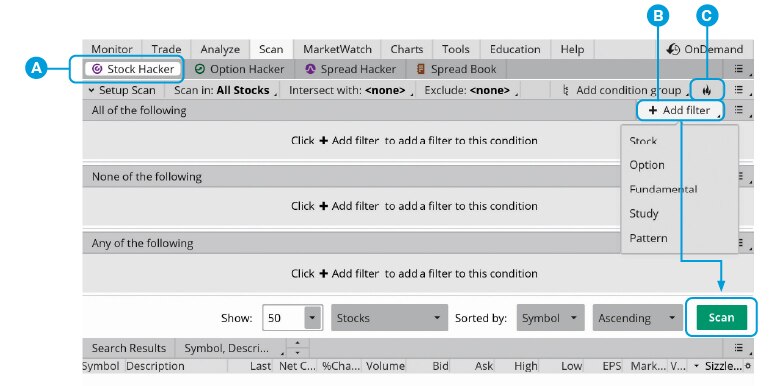
Traders can filter for stocks—as well as exchange-traded funds, futures, and other securities—based on dozens of criteria, including ask, bid, put/call ratio, volume, and fundamental data and technical analysis patterns.
Under Scan, click 🅐 Stock Hacker, add 🅑 filters to the condition groups, then click the Scan button.
" id="body_disclosure--media_disclosure--281921" >Under Scan, click 🅐 Stock Hacker, add 🅑 filters to the condition groups, then click the Scan button.
Find Stocks Using the thinkorswim® Stock Hacker
Find Stocks Using the thinkorswim® Stock Hacker
Sizzle Index™
Using the Sizzle Index, which calculates the ratio of a stock's current options volume against its five-day rolling average, traders can identify market anomalies. A score greater than 1.0 indicates unusual institutional activity or a sudden shift in options sentiment, helping traders spot momentum before it hits the broader news cycle.
Under Scan, click 🅐 Stock Hacker, then click the 🅒 flame icon to load the Top 10 Sizzling Stocks.
Watch some quick tips on how to use the Sizzle Index on the thinkorswim platform.
" id="body_disclosure--media_disclosure--281966" >Under Scan, click 🅐 Stock Hacker, then click the 🅒 flame icon to load the Top 10 Sizzling Stocks.
Watch some quick tips on how to use the Sizzle Index on the thinkorswim platform.
2. Monitor the news
Source: thinkorswim® desktop platform for Mac.
Screenshots are for illustrative purposes only, may be historical in nature, and should not be used as the basis for any investment decision.
Live News
The thinkorswim app streams information like earnings headlines, SEC filings, and sector developments, which traders can filter by stock or keyword and link to an alert or a watchlist.
Use the News
This gadget allows traders to build watchlists using the symbols featured in news stories according to a selection of up to 81 categories listed under seven topics: Sector Summary, Industry, Event News, Asset Class, Market Session, Trading Ideas, and Market Summary.
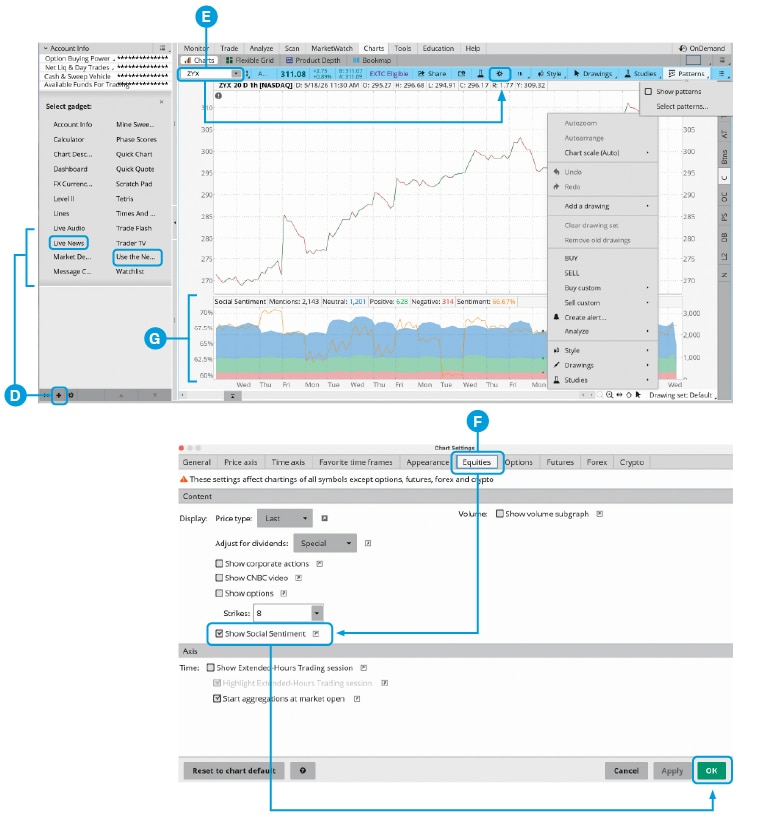
In the left panel, click 🅓 ✚ at the bottom of the screen to add a new gadget, then select Live News or Use the News.
Social Sentiment
Traders can assess the mood for a specific company with a sentiment score that calculates the ratio of positive to negative social media mentions.
Under Charts, enter 🅔 a ticker symbol and click the gear icon to open Chart Settings. Click 🅕 Equities and select Show Social Sentiment, then click OK. The 🅖 Social Sentiment graph will appear at the bottom of the chart. (Note: Social Sentiment is not available for all symbols.)
3. Streamline technical analysis
Patterns
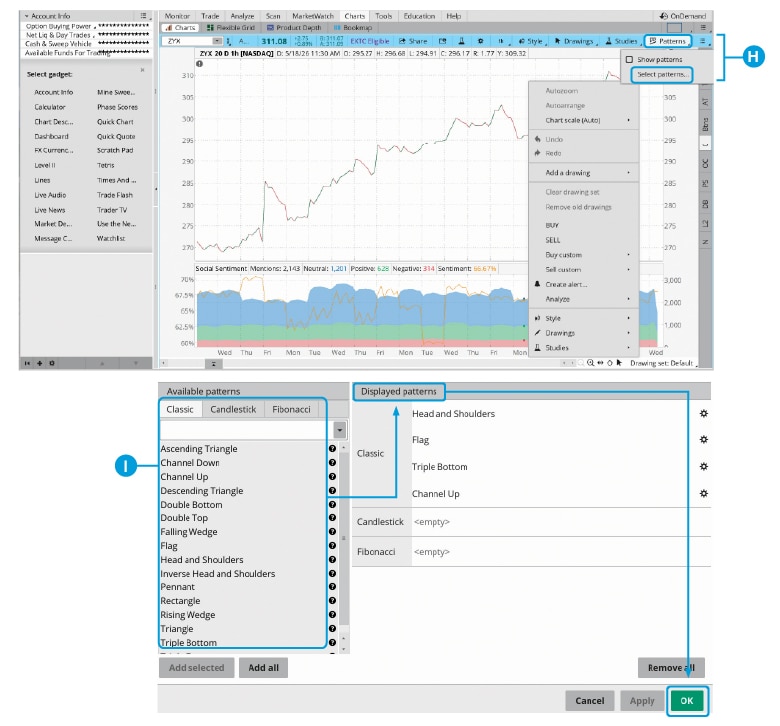
This thinkorswim feature automatically identifies, traces, and labels selected patterns on applicable charts to help traders visualize market shifts and determine potential entry and exit points.
Source: thinkorswim® desktop platform for Mac.
Screenshots are for illustrative purposes only, may be historical in nature, and should not be used as the basis for any investment decision.
Under Charts, click 🅗 Patterns, then Select patterns. Choose from dozens of 🅘 Classic, Candlestick, and Fibonacci patterns in the left column, double-click one or more to display on your chart, then click OK.
Watch a demo on finding price patterns on thinkorswim Charts.
" id="body_disclosure--media_disclosure--281931" >Under Charts, click 🅗 Patterns, then Select patterns. Choose from dozens of 🅘 Classic, Candlestick, and Fibonacci patterns in the left column, double-click one or more to display on your chart, then click OK.
Watch a demo on finding price patterns on thinkorswim Charts.
Alerts
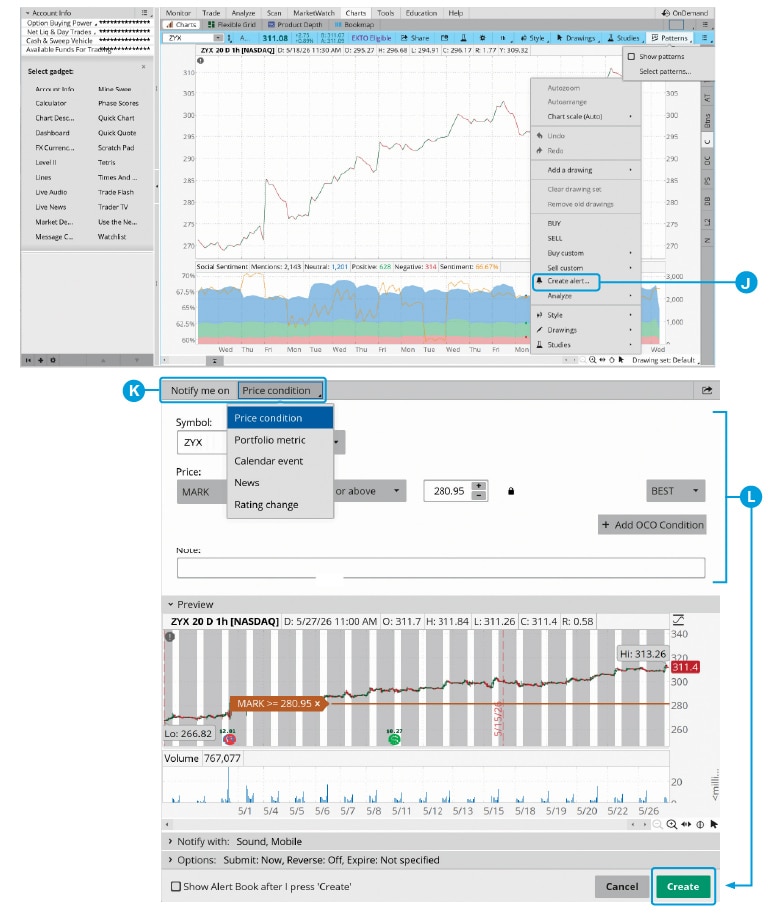
Traders can be notified when certain technical signals are triggered or price conditions are met.
Source: thinkorswim® desktop platform for Mac.
Screenshots are for illustrative purposes only, may be historical in nature, and should not be used as the basis for any investment decision.
Right-click on any chart, then select 🅙 Create alert from the menu. Choose to be notified based on 🅚 Price condition, Portfolio metric, Calendar event, News, or Rating change, set 🅛 your alert parameters, then click Create.
" id="body_disclosure--media_disclosure--281866" >Right-click on any chart, then select 🅙 Create alert from the menu. Choose to be notified based on 🅚 Price condition, Portfolio metric, Calendar event, News, or Rating change, set 🅛 your alert parameters, then click Create.
4. Evaluate performance
Source: thinkorswim® desktop platform for Mac.
Screenshots are for illustrative purposes only, may be historical in nature, and should not be used as the basis for any investment decision.
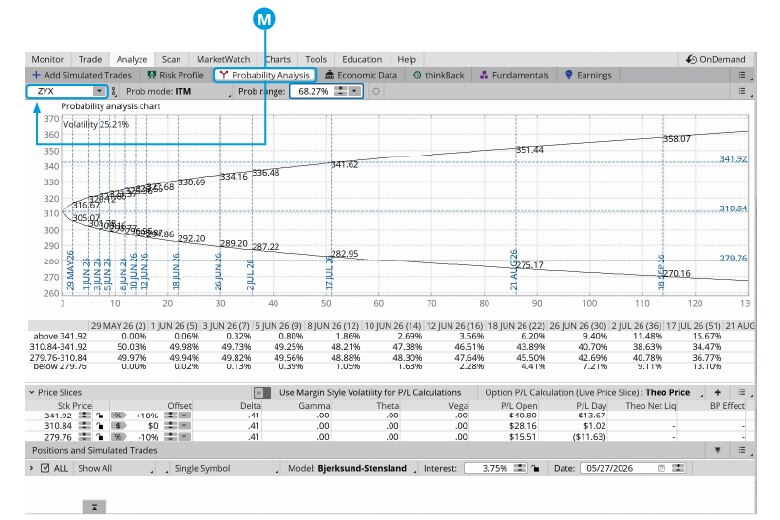
Probability Analysis
Traders can calculate the statistical likelihood of hitting specific price targets within a given time frame.
Under Analyze, click 🅜 Probability Analysis, then enter a ticker symbol to load the probability analysis chart.
" id="body_disclosure--media_disclosure--281951" >Under Analyze, click 🅜 Probability Analysis, then enter a ticker symbol to load the probability analysis chart.
Discover more from Onward

Keep reading the latest issue online or view the print edition.
" id="body_disclosure--media_disclosure--281981" >Keep reading the latest issue online or view the print edition.