Using Implied Volatility Percentages and Rankings
When trading options, you're likely to see a lot of price changes. The magnitude and direction of these changes aren't constant, though, making it challenging to track these changes. Another challenge is differentiating a "normal" change versus the "not-so-normal" kind?
Relative index performance
One way to track changes is to compare the S&P 500® Index (SPX) and the Cboe Volatility Index® (VIX), which many traders believe are inversely related. When the SPX is in rallying mode, the VIX tends to be low. And when the SPX is pulling back, the VIX tends to move higher.
Theoretically, an ultrahigh VIX might indicate an SPX bottom is near, and an ultralow VIX might indicate market exuberance or complacency. Of course, it's good to remember these relationships are only trends, and markets can move in unpredictable ways. Past performance of trends does not guarantee the trend will continue in the future.
Ranking volatility for trading purposes is a little more nuanced, though. Some traders turn to the Implied Volatility (IV) Percentile and Historical Volatility (HV) Percentile readings on the Today's Options Statistics subtab on the thinkorswim® platform when making trading decisions. These indicators reflect how an underlying's current IV compares to the last year's worth of historical readings.
But first, a basic IV/HV refresher.
Implied volatility vs. historical volatility
Implied volatility (IV) indicates how much a stock could move in the future, based on the behavior of options traders. Keep in mind that IV always changes because options prices are always changing, depending on how the market anticipates future price moves. For example, IV often rises ahead of expected price moves and falls after events like earnings announcements.
Historical volatility (HV) measures the fluctuation of past prices over a period of time, illustrating how volatile a stock has been in the past. A stock with an HV of 10 has been less volatile than a stock with an HV of 35. It's also possible for a stock to have an HV of 50 during one period and 15 during another.
You can use IV and HV data—including 52-week highs and lows, and current readings—when ranking volatility. To do this on the thinkorswim platform, enter a stock ticker, and under the Trade tab, open Today's Options Statistics located below the Option Chain (see image below).
Implied volatility rank
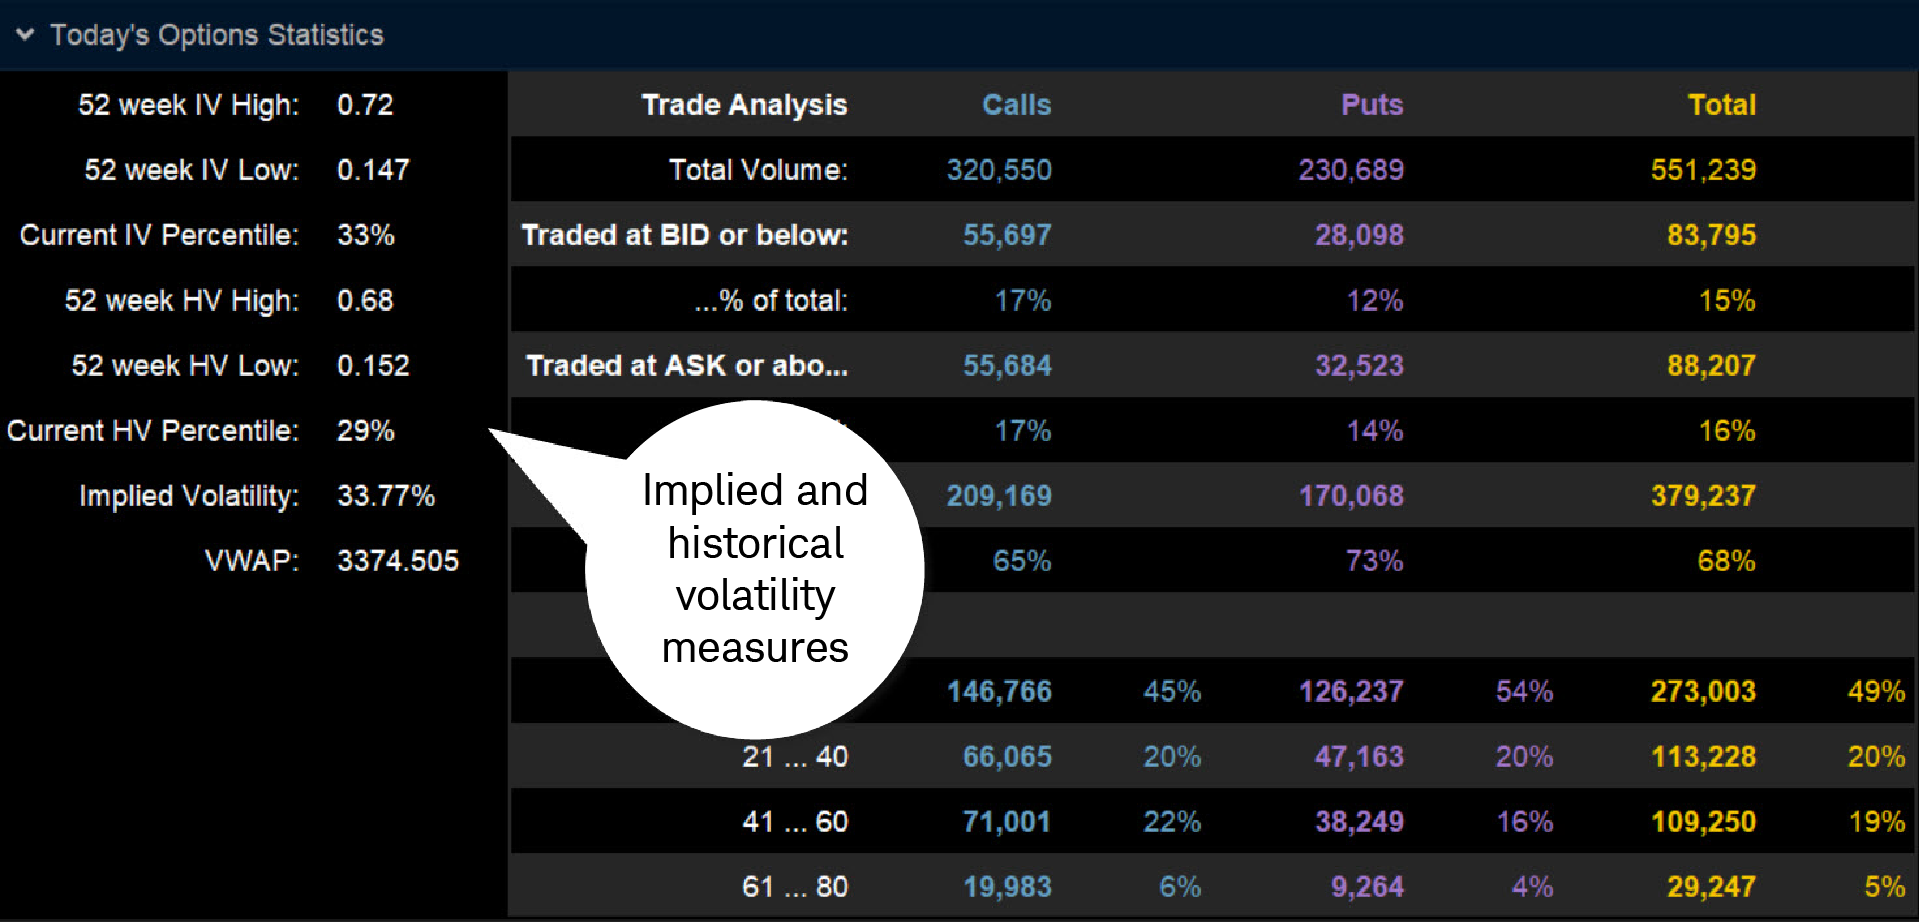
Source: thinkorswim platform
IV is calculated from the prices of currently listed options and expressed in annualized terms. The IV percentile can range from near zero to near 100%. For example, the stock in the image above shows an implied volatility of 33.77%. This means the options market is essentially pricing in variability of about 34% above or below the current price on an annualized basis.
Other data on the page can help put it in perspective:
- 52-Week IV High/Low. Over the last year, the stock in the image above has seen IV as high as 72% and as low as 14.7%.
- Current IV Percentile. Sometimes referred to as the implied volatility rank (IVR), this reading of 33% indicates that the stock's current IV is within the lowest one-third of all IV readings from the last 52 weeks.
Measured on a 0-100 scale, a low IVR suggests the current IV is near its low point for the year, while a high IVR indicates the opposite. For example, if ZYX's implied volatility swung between 15 and 45 during a 52-week period and its current IV was 30, its IVR, or "Current IV Percentile," would be 50%.
" id="body_disclosure--media_disclosure--210236" >Measured on a 0-100 scale, a low IVR suggests the current IV is near its low point for the year, while a high IVR indicates the opposite. For example, if ZYX's implied volatility swung between 15 and 45 during a 52-week period and its current IV was 30, its IVR, or "Current IV Percentile," would be 50%.
IV is relatively low in this stock right now. Is it warranted? One way to help decide is by comparing IV data to the HV data.
IV is a forward-looking measure implied by the options market, while HV is backward looking. HV is a moving average of actual price variability in the stock over the previous 52 weeks:
- 52-Week HV High/Low. Notice that, over the past year, the stock's HV has been as high as 68% and as low as 15.2%. So, the stock has been quite volatile at times and relatively static at other times.
- Current HV Percentile. At 29%, the current HV reading, or historical volatility rank, is a little lower than the current IV percentile, meaning it's even lower in comparison to the past year's worth of readings.
Let's review some implications of this comparison. If IV and HV are expected to follow each other up and down, an IV that's lower than HV could potentially suggest IV is understating the stock's potential price change. An IV that's higher than HV could potentially suggest the opposite.
Comparing the two can be a useful way to understand how much expected volatility is being priced into options versus how much volatility actually tends to materialize. With all else equal, higher IV relative to HV can suggest options are expensive, while lower IV can suggest options are inexpensive. Keep in mind, however, that IV is an estimate and past performance does not guarantee future results.
Trading with the IV percentile
For option traders, volatility measures can be important when selecting a trading strategy. For example, a high IV percentile might indicate options premiums are relatively high, and there may be opportunities to use short options strategies like short vertical spreads, covered calls, or cash-secured puts. A low IV percentile might indicate options premiums are relatively low, and there may be opportunities to use long options strategies like calendar spreads or long vertical spreads.
Regardless of which products you trade or how often you trade them, options statistics can help you track volatility, evaluate current metrics as they relate to historical action, and make more informed trading decisions.